
A Practical Framework for Technical Indicators
How to Read Trend, Volatility, Momentum and Volume Without Overcomplicating the Chart
Indicators are most useful when they help answer a specific market question. A moving average can clarify direction; Bollinger Bands can show how volatility is changing; RSI and MACD can reveal shifts in momentum; and volume-based tools can help assess participation.
The purpose of this lesson is not to memorise a collection of signals. It is to learn how different indicators fit into a structured analysis process.
Start with the market question → choose the tool → read it in context → look for confirmation

1. Start With the Market, Not the Indicator
A common beginner mistake is to add several indicators first and then search for a reason to trade.
A cleaner approach is the opposite: observe the market, decide what information is missing and then choose an indicator that can help organise that information.
For example, if price is moving strongly in one direction, the useful question may be whether the trend is still intact. If price is moving sideways, volatility and momentum may be more relevant.
This prevents the chart from becoming crowded with tools that all measure roughly the same thing.
2. Direction: Using Moving Averages as a Trend Filter
Moving averages reduce short-term price noise by smoothing a sequence of past prices.
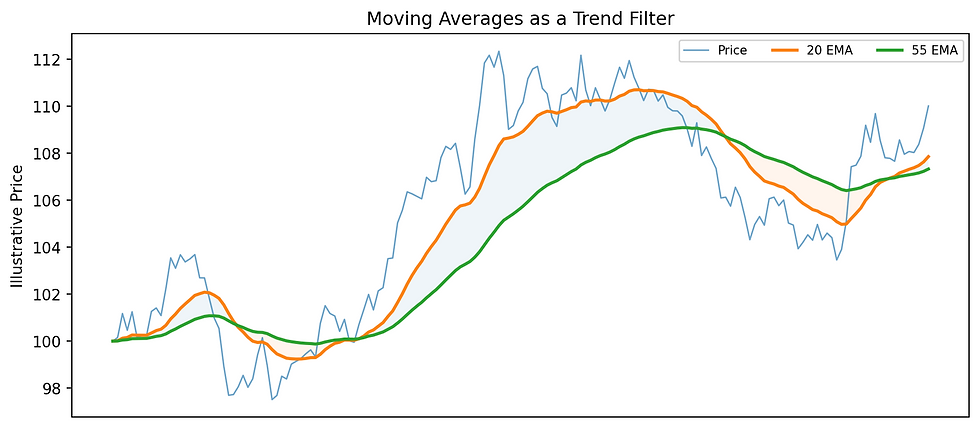
Their greatest value is often not the exact number displayed by the line, but the relationship between price, the average and other averages.
Reading the Relationship
When price remains above a rising average, the market is behaving differently from a market that repeatedly trades below a falling average.
A faster average also reacts sooner than a slower one, which can help show whether recent movement is strengthening or weakening relative to the broader trend.
SMA, EMA and WMA
The source material distinguishes three common moving-average types:
A Simple Moving Average (SMA) gives equal weight to observations in its lookback window.
An Exponential Moving Average (EMA) places more emphasis on recent prices.
A Weighted Moving Average (WMA) also prioritises newer data through an explicit weighting scheme.
The practical difference is responsiveness. Faster-reacting averages follow new price changes more closely, but can also react to more short-term noise.
What About Crossovers?
Crossovers between a faster and slower average can help describe a change in trend behaviour, but they should not be treated as exact turning-point signals.
Because both lines are built from historical prices, the crossover normally occurs after price has already started moving in the new direction.
Moving averages are better at describing a developing trend than predicting the exact top or bottom.
3. Volatility: Reading Bollinger Bands as a Market Regime Tool
Bollinger Bands place an upper and lower volatility band around a moving-average centre line.
In the common default setting referenced in the source material, the outer bands are positioned two standard deviations from the middle average.

The important information is often the width and behaviour of the bands.
Narrower bands suggest that recent movement has become relatively compressed. Wider bands show that price variation has increased.
A transition from contraction to expansion can therefore help identify a change in market conditions.
Why Touching a Band Is Not Enough
It is tempting to assume that touching the upper band means price is “too high” or touching the lower band means price is “too low”. That interpretation is incomplete.
During a strong trend, price can travel near an outer band for a sustained period. The band should therefore be read together with trend structure rather than used as an automatic reversal signal.
4. Momentum: RSI as a Measure of Pressure
The Relative Strength Index (RSI) is a momentum oscillator displayed between 0 and 100.
The source lesson uses 70 and 30 as common reference zones for relatively strong and weak momentum.

A reading above 70 does not guarantee that price must fall, just as a reading below 30 does not guarantee an immediate rise.
In a persistent trend, RSI can remain elevated or depressed for longer than expected. A more useful question is whether momentum is continuing to support the price move or beginning to change.
The 50 Area
Although the source focuses mainly on 70 and 30, the centre of the RSI range can also be useful as a neutral reference when interpreting momentum.
This is an added analytical framework for the website lesson rather than a separate signal rule from the slides.
5. Momentum Shifts: Understanding MACD
MACD compares a faster exponential moving average with a slower one.
In the standard configuration covered by the source material, the MACD line is based on the relationship between 12- and 26-period EMAs, while a 9-period EMA of that line forms the signal line.

Rather than focusing only on a crossover, MACD can be read as a story about momentum.
When the distance between the MACD and signal lines expands, the histogram becomes larger. When the distance contracts, the histogram shrinks.
This can help visualise whether directional momentum is building or fading.
Convergence and Divergence
The source lesson also introduces convergence and divergence.
When price and the indicator broadly confirm each other, momentum is aligned with the price move.
When they disagree—for example, price continues to make stronger highs while momentum does not—the disagreement can act as a warning.
It is still only a warning: divergence can remain present while the market continues in its existing direction.
6. Participation: What Volume Indicators Add
Price tells us where the market moved. Volume-based indicators add information about participation.
The source lesson covers two different approaches:
On-Balance Volume (OBV) accumulates volume according to the direction of closing prices.
Money Flow Index (MFI) combines price and volume into an oscillator.

OBV: Is Participation Confirming Direction?
OBV adds a period’s volume when price closes higher than the previous period and subtracts it when price closes lower.
The running total creates a line that can be compared with price. The absolute number is less important than whether OBV is broadly confirming or disagreeing with the direction of price.
MFI: Price and Volume in One Oscillator
MFI is displayed on a 0–100 scale. The source material uses 80 as an overbought reference and 20 as an oversold reference.
Like RSI, these are zones for interpretation rather than guaranteed turning points. A strong trend can keep MFI near an extreme for an extended period.
7. Combining Indicators Without Duplicating Information
Using more indicators does not automatically produce better analysis.
If several indicators are all derived from similar price relationships, they may simply repeat the same message in different forms.
A more balanced approach is to combine tools that answer different questions.

Question | Example tool | Role in the analysis |
What is the market structure? | Price action and key levels | Provides the context before indicators are added |
What is the direction? | Moving average | Helps filter trend direction |
Is volatility changing? | Bollinger Bands | Shows contraction or expansion in recent movement |
Is momentum supporting the move? | RSI or MACD | Adds information about strength and momentum shifts |
Is participation confirming it? | OBV or MFI | Adds a volume-based perspective |
8. Practical Example: Building a Simple Analysis
Imagine price has broken above a well-observed resistance area.
Instead of immediately treating the breakout as a trade signal, an analyst could build the view in stages:
Structure
Confirm that price has actually broken and held above the previous resistance area.
Direction
Check whether price is also trading above a rising moving average.
Volatility
Observe whether Bollinger Bands are beginning to expand after a period of compression.
Momentum
Check whether RSI or MACD is supporting the move rather than weakening sharply.
Participation
Use OBV or MFI to see whether volume behaviour broadly confirms the price move.
None of these observations guarantees that the breakout will continue. Their purpose is to create a more structured decision process and reduce dependence on a single indicator.
9. Common Indicator Mistakes

Stacking Too Many Similar Tools
Several momentum indicators may all appear to “confirm” one another simply because they are built from related price data.
This can create false confidence rather than genuinely independent confirmation.
Treating Thresholds as Automatic Buy or Sell Signals
Overbought and oversold zones describe the condition of an oscillator, not a guaranteed future direction.
Strong trends can remain stretched for long periods.
Ignoring Market Regime
An indicator that appears useful in a sideways market may behave very differently during a strong trend.
The market environment should therefore be considered before interpreting the indicator.
Ignoring Fundamental Events
The source material warns that indicators do not understand economic announcements or fundamental developments.
A major release can cause rapid price movement even when technical indicators were pointing in another direction.
10. A Better Way to Use Indicators
A practical indicator workflow is simple:
Begin with price structure.
Identify the question you need answered.
Choose one appropriate tool.
Look for supporting evidence from a different category if necessary.
Apply risk management throughout the process.
This keeps the chart readable and makes the logic behind the analysis easier to explain and test.
Price first. Indicator second. Confirmation third. Risk management throughout.
Key Takeaways
Indicators process historical market data; they do not know the future.
Moving averages are useful for trend filtering, while Bollinger Bands focus on volatility.
RSI and MACD both study momentum but present it differently.
OBV and MFI introduce a volume-based view of market participation.
Extreme oscillator readings can persist during strong trends.
Combining different categories of evidence is more useful than stacking several similar indicators.
Indicators can lag and can be disrupted by fundamental events.
Educational Notice: This material is provided for educational purposes only and is intended to explain general technical-analysis concepts. It does not constitute investment advice, a personal recommendation, or an offer or solicitation to buy or sell any financial instrument. Technical indicators can produce false or delayed signals, and leveraged trading involves significant risk.


Comments