
Elliott Wave Theory
A Practical Guide to Wave Structure, Corrections, Fibonacci and Momentum Confirmation
Elliott Wave Theory is a framework for interpreting recurring market structures.
The course describes markets as moving through impulsive phases in the direction of a larger trend and corrective phases against it, with the same broad patterns appearing at different degrees or timeframes.
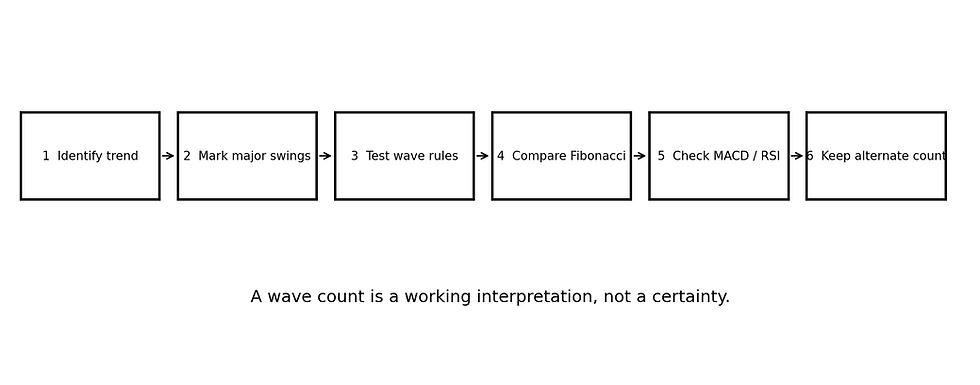
Structure first → validate the count → compare Fibonacci → check momentum → keep alternative scenarios
1. What Is Elliott Wave Theory?
Developed by Ralph Nelson Elliott in the 1930s, the theory proposes that crowd behaviour and market psychology create recurring price patterns.
A key idea is fractality: a wave visible on one timeframe can contain smaller waves, while also forming part of a larger structure.

What Is a Wave?
Markets rarely move in a straight line. Periods of concentrated buying or selling are often followed by corrections.
Elliott described these directional price movements and corrections as waves, linking them to shifts between optimism and pessimism.
2. The Core 5–3 Structure
The central framework is a 5–3 sequence: five waves move with the dominant trend, followed by a three-wave A–B–C correction.
Within the five-wave phase, Waves 1, 3 and 5 move with the trend, while Waves 2 and 4 move against it.

Impulse = 1–2–3–4–5. Correction = A–B–C.
3. The Five Impulsive Waves

Wave 1 — The New Phase
Wave 1 begins the five-wave structure and can be difficult to recognise because it may initially look like a move against the previous trend.
The source course treats it as an uncertain early phase.
Wave 2 — The First Retracement
Wave 2 moves against Wave 1.
In the course framework, it must not move beyond the start of Wave 1; otherwise, the proposed count is considered flawed.
Wave 3 — Expansion and Confidence
Wave 3 is described as usually the longest and strongest part of the impulse.
It represents growing confidence and wider participation in the new trend.
Wave 4 — The Final Retracement
Wave 4 is another corrective phase inside the impulse and is presented as generally weaker than Wave 2.
Wave 5 — The Final Push
Wave 5 completes the five-wave structure.
The course associates it with late participation, profit-taking and a market that may be approaching exhaustion.

4. The A–B–C Corrective Pattern
After the five-wave phase, the course introduces an A–B–C correction moving against the established trend.
Wave A begins the correction.
Wave B temporarily moves back in the direction of the old trend.
Wave C resumes the correction.
Corrective phases can be harder to interpret than clean impulsive trends because they often contain consolidation and competing short-term moves.
The source course highlights three common corrective forms: zigzag, triangle and flat.

5. Corrective Patterns in More Detail
Zigzag
The course characterises zigzags as sharp corrections with relatively steep moves.
Visually, they can resemble a flag-like correction inside a larger trend.
Triangle
Triangles represent a stand-off between buyers and sellers.
The course notes that they may appear as symmetrical, ascending or descending formations depending on market sentiment.
Flat
Flat corrections are more sideways in character and can create a longer consolidation phase before a breakout.
6. Three Rules Used to Test a Wave Count
Elliott Wave analysis becomes more useful when the proposed count is tested against structural rules rather than fitted to every price movement after the fact.

The source material states:
Wave 2 must not move beyond the start of Wave 1.
Wave 3 cannot be the shortest impulse wave.
Wave 4 must follow the structural restriction presented in the course.
When a proposed count violates a core rule, the analyst should reconsider the count rather than force the pattern.
7. Fractals and Wave Degrees
The same broad Elliott pattern can be analysed at multiple degrees.
The course lists degrees ranging from:
Grand Super-Cycle
Super-Cycle
Cycle
Primary
Intermediate
Minor
Minute
Minuette
Subminuette
The practical implication is that a corrective move on a short timeframe can still sit inside a larger impulsive wave.
8. Fibonacci Ratios and Elliott Wave
The course links Elliott Wave analysis with Fibonacci retracements and extensions.
Rather than proving a wave count, Fibonacci provides proportional reference areas that can be compared with the proposed structure.
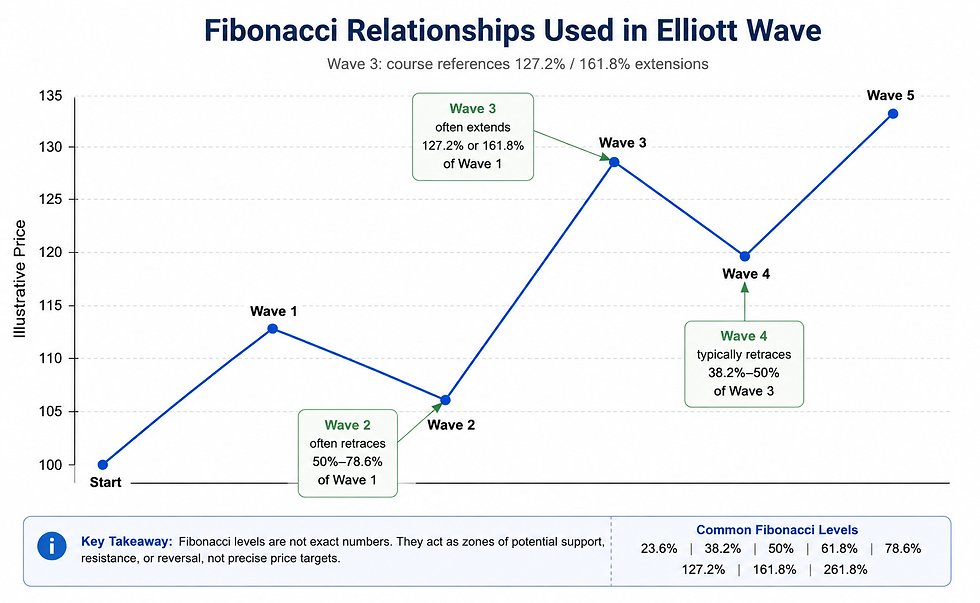
Wave relationship | Course reference |
Wave 2 vs Wave 1 | Often 50%–78.6% retracement |
Wave 3 vs Wave 1 | Around 127.2% extension |
Wave 3 or Wave 5 | 161.8% extension reference |
Wave 4 vs Waves 1–3 | Often 38.2%–50% retracement |
These are reference relationships, not fixed requirements.
The chart still needs to satisfy the wave structure, and the market may behave differently from a typical Fibonacci relationship.
9. Advanced Elliott Wave Structures
The course introduces several advanced situations that make real charts less tidy than textbook examples: extensions, truncations and complex corrective waves.

An extension occurs when a wave, especially Wave 3, becomes unusually long.
A truncation occurs when Wave 5 fails to exceed Wave 3.
Complex corrections can contain double or triple zigzags and therefore require more practice to identify.
10. Using MACD With Elliott Wave
The course uses MACD as a complementary momentum tool.
The idea is to compare the proposed wave count with momentum behaviour: an impulsive Wave 3 should generally display stronger momentum than a corrective phase, while Wave 2 or Wave 4 may show flatter or less decisive MACD behaviour.

For an uptrend, the source course looks for stronger MACD readings during Wave 3 and weakening or crossover behaviour as the structure approaches its later stages.
MACD is therefore presented as confirmation rather than a replacement for the wave count.
11. Using RSI With Elliott Wave
RSI is presented as another momentum-confirmation tool.
The source course associates strong RSI readings with strong impulsive phases, particularly Wave 3, and uses changing momentum near the later part of the structure as a possible clue that the move is becoming exhausted.

12. A Practical Elliott Wave Analysis Process
Start with the larger market direction rather than immediately numbering every small movement.
Mark the clearest significant swings and test whether a 1–2–3–4–5 structure is plausible.
Check the structural rules. If the count violates a core rule, reconsider it.
Separate impulsive movement from corrective movement and identify whether a correction resembles a zigzag, triangle or flat.
Compare the proposed waves with Fibonacci relationships presented in the course.
Use MACD or RSI as supporting evidence for momentum and possible exhaustion.
Keep an alternative wave count when the chart is ambiguous instead of treating one interpretation as certain.
13. Limitations and Common Mistakes
The course emphasises that Elliott Wave has a steep learning curve.
Identifying smaller wave degrees inside larger structures can be difficult, and a different market scenario can emerge even when a count appears reasonable.
It also warns against relying on wave analysis alone. MACD and other momentum tools can provide supporting evidence.
The course further notes that modern markets contain algorithmic participants as well as human participants, which it presents as another reason not to assume the theory will always be accurate.
Treat a wave count as a structured market hypothesis—not as a guaranteed forecast.
Key Takeaways
Elliott Wave Theory is built around recurring, fractal market structures.
The core pattern is five waves with the trend followed by an A–B–C correction.
Waves 1, 3 and 5 are impulsive; Waves 2 and 4 are corrective within the five-wave phase.
Corrective structures highlighted in the course include zigzags, triangles and flats.
Structural rules help invalidate weak wave counts.
Fibonacci ratios provide proportional reference areas for retracements and extensions.
MACD and RSI can be used as supporting momentum evidence.
Extensions, truncations and complex corrections make real-world wave counting more difficult.
The method is interpretive and should not be treated as a fool-proof forecasting system.
Educational Notice: This material is provided for educational purposes only. It explains general technical-analysis concepts and does not constitute investment advice, a personal recommendation, or an offer or solicitation to buy or sell any financial instrument. Elliott Wave counts are interpretive and can change as new price information becomes available. Leveraged trading involves significant risk.


Comments