
Fibonacci Tools in Technical Analysis
A Practical Guide to Retracements, Extensions, Time and Confluence
Fibonacci tools are used to organise a price swing into proportional reference areas.
Rather than treating those percentages as automatic trading signals, this lesson focuses on a more practical question: how can Fibonacci help us structure a pullback, project possible continuation areas and combine several pieces of technical evidence?
Measure the swing → map reference areas → observe the reaction → look for confirmation

1. From a Number Sequence to a Charting Framework
The Fibonacci sequence begins 0, 1, 1, 2, 3, 5, 8 and continues by adding the previous two numbers.
For market analysis, the sequence itself matters less than the ratios derived from relationships between its numbers. Those ratios are converted into percentages and then applied to the distance between important price points.
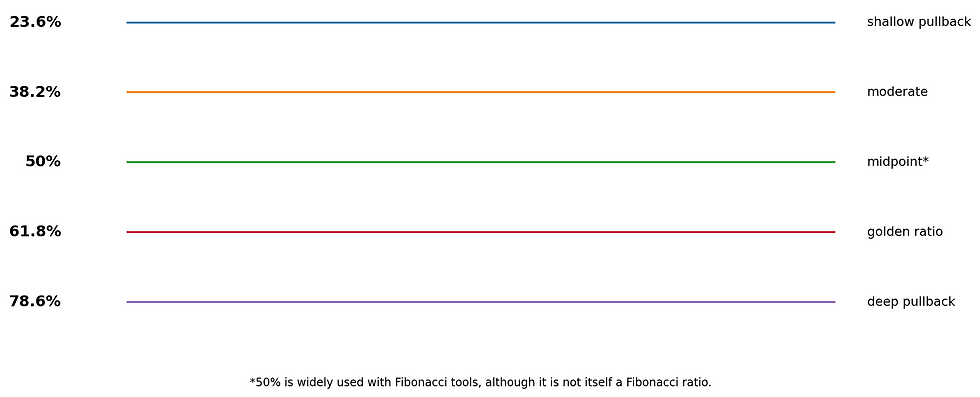
Common charting levels include:
23.6%
38.2%
61.8%
78.6%
The 61.8% relationship is often called the golden ratio.
A 50% midpoint is also widely displayed by Fibonacci tools even though it is not technically a Fibonacci ratio.
2. Retracement: Measuring the Pullback
Markets rarely move in a straight line. A directional move can pause, retrace part of its distance and then either resume or fail.
Fibonacci retracement divides the original swing into horizontal reference areas so that a trader can judge the depth of that pullback.
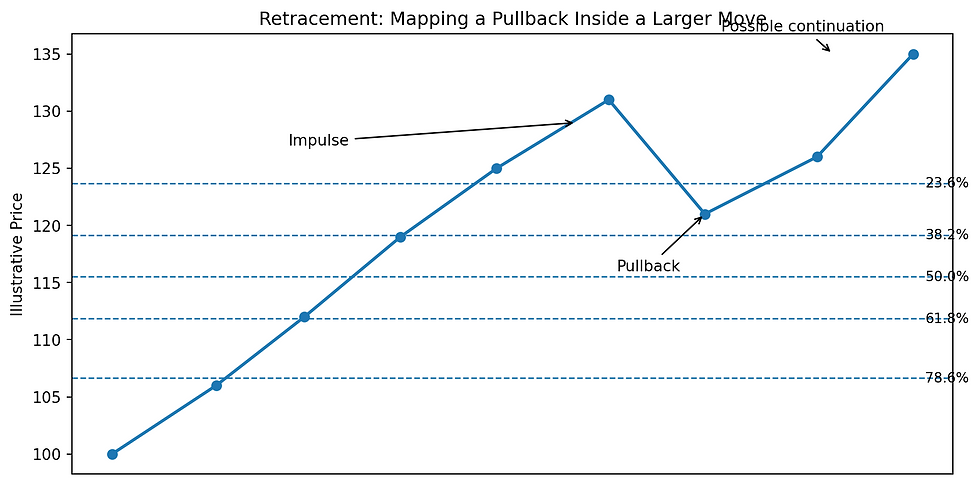
A shallow pullback and a deep pullback describe different market behaviour.
The percentage does not tell us what price must do next. It tells us how much of the prior swing has been given back.
That makes retracement most useful when it is read alongside trend structure, prior support or resistance and the way price reacts around the area.
A Fibonacci level is better treated as an area to watch than as a guaranteed turning point.
3. Choosing the Correct Swing
The quality of a Fibonacci reading depends heavily on the anchors. The course material emphasises significant swing highs and swing lows.
In an uptrend, the retracement tool is normally drawn from the swing low to the swing high. In a downtrend, the direction is reversed.
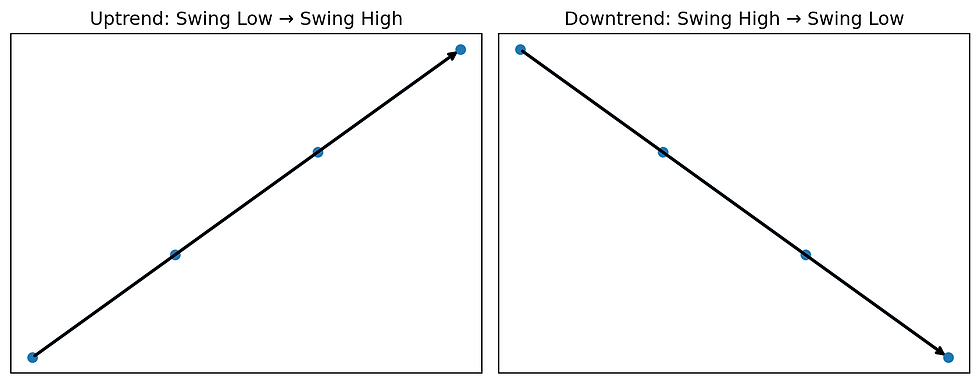
This is where subjectivity enters the process. Two analysts may choose different swings, especially on a noisy chart.
A useful discipline is to choose a swing that is visually meaningful in the timeframe being analysed rather than repeatedly adjusting anchors until a level fits the latest price.
4. Reading Retracement Levels in Context
The individual percentages should not be viewed as isolated signals.
A 38.2% retracement that overlaps a previous breakout area can be more informative than a 38.2% level sitting in the middle of an otherwise featureless chart.
Likewise, a deeper 61.8% or 78.6% retracement may still be consistent with the original trend, but it also shows that price has surrendered more of the initial move.
What the 50% Level Adds
The 50% level is a simple midpoint of the measured swing.
Although it is not a Fibonacci ratio, it is commonly included because market participants often pay attention to the halfway point between a significant high and low.
5. Extension: Looking Beyond the Original Swing
Retracement asks how far price has moved back inside an existing swing.
Extension asks a different question: if the move continues beyond the previous extreme, where are useful proportional reference areas outside the original range?

The source course highlights the following commonly used extension levels:
127.2%
161.8%
261.8%
These can be used as potential target or reaction areas, but price behaviour around the level remains important.
A market may pause, consolidate, reverse or move straight through an extension.
Retracement vs Extension
Tool | Main question | Typical location |
Retracement | How much of the previous swing has price given back? | Inside the original swing |
Extension | Where could proportional reference areas appear if price continues? | Beyond the original swing |
6. Fibonacci Time Zones: Adding a Time Dimension
Most Fibonacci tools are drawn primarily around price. Fibonacci Time Zones shift the focus towards time by placing vertical lines at intervals based on Fibonacci numbers.
The idea is not that a reversal must occur on a specific line, but that certain future intervals can be marked for closer observation.

Because Time Zones do not specify the direction or size of a future move, they are more useful as timing markers than as standalone signals.
If a time interval coincides with an important price level or a visible change in price behaviour, the overlap may deserve more attention.
7. Fibonacci Fan: Turning Ratios Into Diagonal Structure
A Fibonacci Fan begins with a baseline between a significant high and low and projects diagonal lines using Fibonacci proportions.
Unlike horizontal retracement levels, the fan changes with time because its reference lines slope across the chart.

The course material associates fan lines with possible support or resistance during a correction.
In practice, their value comes from watching how price behaves as it approaches the diagonal area rather than assuming the line itself will force a reaction.
8. Fibonacci Arcs: Price Distance Meets Curved Geometry
Fibonacci Arcs also begin with a baseline connecting two important price points.
Curved reference areas are then plotted using Fibonacci proportions such as 38.2%, 50%, 61.8% and 78.6%.
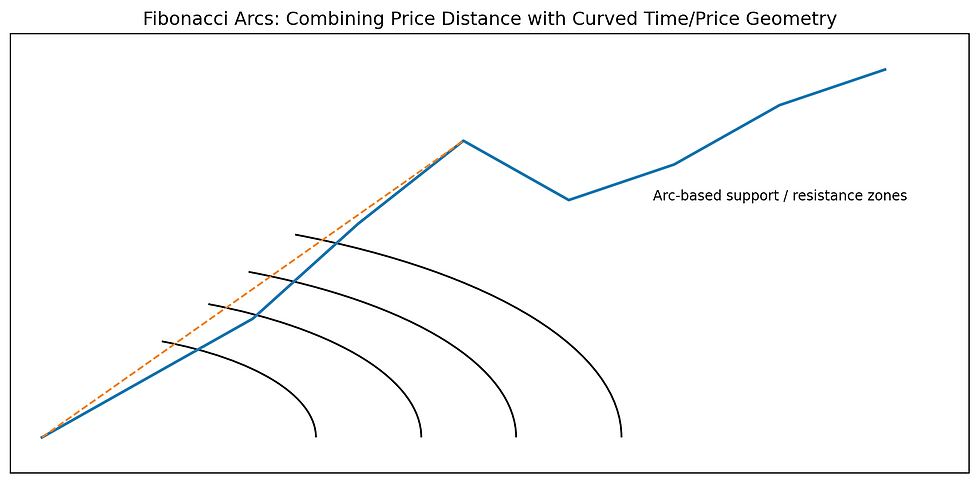
Because the arcs expand through both price and time, their shape differs from standard horizontal retracement lines.
They are intended to highlight possible support or resistance areas, but they remain interpretive tools and should be read with the surrounding chart structure.
9. Confluence: When Several References Point to the Same Area
Confluence is one of the most practical ways to use Fibonacci.
Instead of asking whether one percentage is “correct”, an analyst looks for a zone where several independent references overlap.

For example, a retracement level may sit close to a previous horizontal support area, while a fan line or visible price-action reaction appears in the same region.
The overlap does not guarantee a reversal, but it provides more context than a single Fibonacci line viewed in isolation.
10. A Practical Analysis Process
Identify the market structure first. Decide whether there is a clear directional swing worth measuring.
Choose a meaningful swing high and swing low for the timeframe being analysed.
Apply retracement levels and note which areas overlap with existing chart structure.
Use extension levels as reference areas if price resumes through the previous extreme, rather than treating them as fixed outcomes.
Use Time Zones, Fans or Arcs selectively when they add a distinct perspective rather than cluttering the chart.
Wait for price behaviour or independent confirmation before drawing conclusions.
11. Common Mistakes and Limitations
Fibonacci percentages are objective calculations, but their application is not fully objective because the analyst must choose the swing points.
Changing those anchors changes the levels. This is one reason different traders can produce different Fibonacci maps on the same chart.
The levels are also not always respected. Markets influenced by major news, political events or other non-technical factors can move through projected areas with little reaction.
Fibonacci should therefore not be treated as a “holy grail” or as a substitute for risk management.
Use Fibonacci to structure possibilities, not to manufacture certainty.
Key Takeaways
Fibonacci ratios convert a measured price swing into proportional reference areas.
Retracements are mapped inside a swing; extensions project beyond it.
The 50% midpoint is commonly used even though it is not technically a Fibonacci ratio.
Anchor selection matters: uptrends are commonly measured low-to-high and downtrends high-to-low.
Time Zones focus on intervals, while Fans and Arcs add diagonal or curved geometry.
Confluence is more informative than relying on one Fibonacci level in isolation.
Every Fibonacci tool remains interpretive and can fail, especially when non-technical events dominate price.
Educational Notice: This material is provided for educational purposes only. It explains general technical-analysis concepts and does not constitute investment advice, a personal recommendation, or an offer or solicitation to buy or sell any financial instrument. Fibonacci levels are interpretive tools and do not guarantee future market behaviour. Leveraged trading involves significant risk.


Comments