
Risk Management in Trading
Position Sizing, Risk-to-Reward, Stop Losses, Scaling and Hedging
Risk management is the part of a trading process that defines how much capital is exposed, where a trade should be exited if the idea is wrong, how potential reward compares with risk, and how exposure can be adjusted as a position develops.

The objective is not to remove risk. It is to define, control and review it before risk becomes unmanageable.
1. Why Risk Management Matters
The source course places capital preservation at the centre of trading.
Its core message is simple: a trader cannot continue participating if losses become large enough to remove the trading capital. Risk management therefore starts before an entry is placed, not after a position moves against the trader.
The course opens with a statistic about its own traders losing money early in their trading journey. Because the source does not provide methodology for that statistic, this webpage version treats it as a course-specific observation rather than a general market statistic.
2. Position Sizing
Position sizing determines how much market exposure a trader takes.
The course uses a Forex illustration in which a one-lot position is approximately $10 per pip, so a 20-pip adverse movement would be approximately $200.
The exact pip value can vary by instrument, quote currency and account setup, so the principle is more important than the example: position size and stop distance jointly determine the money at risk.
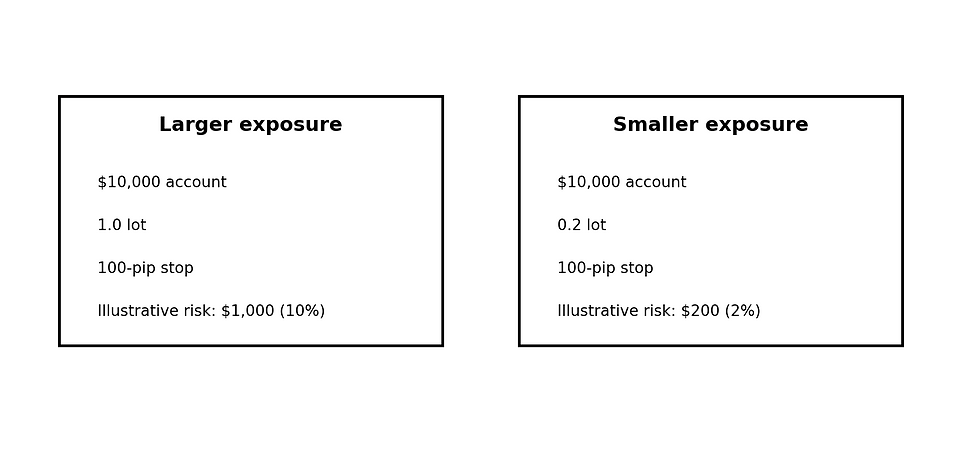
A Simple Risk Budget
The course contrasts a $10,000 account risking about $1,000 on a 100-pip stop with a smaller position risking about $200.
In its example, that is roughly 10% versus 2% of the account. The purpose of the comparison is to show how oversized positions reduce the margin for error.
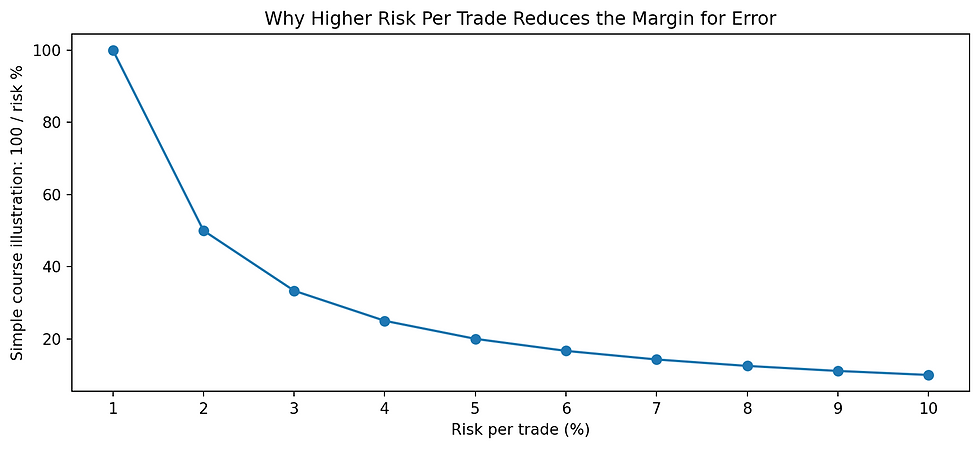
The source includes a simple table that divides 100 by the percentage risk per trade to illustrate how quickly repeated full-risk losses could consume an account.
This is a simplified teaching illustration rather than a compounding model.
3. Risk-to-Reward
Risk-to-reward compares the amount a trader is prepared to lose with the potential amount the trade is intended to make.
A 1:1 structure risks one unit to target one unit of reward. A 1:2 structure risks one unit to target two units.

The source course recommends looking for at least 1:2. That is the course’s rule of thumb, not a universal requirement.
Whether a strategy is viable also depends on its win rate, execution costs and how consistently the plan is followed.
Why Risk-to-Reward Changes the Outcome
One of the strongest examples in the source compares two traders who begin with $10,000, risk 2%, and experience the same sequence of wins and losses.
Trader A uses a 1:0.5 reward profile and ends at $9,500. Trader B uses 1:2 and ends at $10,998 in the course example.

A trader does not need every trade to win. The size of wins relative to losses materially changes the result.
4. Define, Set, Determine, Calculate
The course presents a four-step sequence for planning a trade:
Define the entry point based on the trading analysis and strategy.
Set the stop-loss level at the price where the trade should be exited to limit the loss.
Determine the take-profit level based on the analysis.
Calculate the potential loss and potential profit so the risk-to-reward relationship is known before entry.
5. Stop Losses
A stop-loss order is an instruction to close a trade when a specified price is reached or exceeded.
The course presents stop losses as a capital-protection mechanism and distinguishes between a stop-loss order, a manual market stop and a trailing stop.
Stop-Loss Order
The purpose of a stop is to define where the original trade idea is no longer accepted.
The course stresses that capital preservation should take priority over hoping that a losing position eventually reverses.

Manual Market Stop
The source describes a market stop as manually closing a position after losses reach a certain point.
It does not recommend this approach because an open position can influence judgement and inexperienced traders may hesitate to realise a loss.
Trailing Stop
A trailing stop automatically adjusts the protection level as a trade moves favourably.
The course notes that trailing stops can be less suitable in choppy or highly volatile conditions and describes them as working better when prices trend more gradually.

6. How the Course Approaches Stop Placement
The source highlights three considerations when deciding where a stop might sit: support and resistance, multiple timeframes, and fundamental events.
Support and Resistance
For a bullish setup, the course suggests identifying a meaningful support area and allowing enough room below it so that the stop is not placed too tightly around normal price fluctuations.
Multiple Timeframes
Short-, medium- and longer-term charts can be compared to identify levels that may not be obvious on only one timeframe.
Fundamental Factors
Economic data and political events can create significant price swings.
The course therefore advises checking the economic calendar and monitoring relevant news around planned trades.
7. Scaling Into a Position
Scaling in means beginning with smaller exposure and adding to the position gradually.
The source presents this as a way of limiting the initial loss if the first entry fails quickly.
Its example uses $100,000 of capital with a planned total risk of 2%, or $2,000:
Entry 1: Risks 1%, or $1,000.
Entry 2: Risks 0.5%, or $500.
Entry 3: Risks 0.5%, or $500.
If the first entry fails immediately, only half of the originally planned $2,000 risk has been used.

8. Scaling Out of a Position
Scaling out is the opposite process: closing parts of a position gradually instead of exiting everything at one price.
The course describes this as a way to realise some profit while leaving part of the position open. This can also reduce the psychological pressure of trying to identify one perfect exit.
In the source example, a two-lot position is divided into:
A 50% first exit
A 25% second exit
A 25% final exit
The course uses increasingly distant reward targets to illustrate the idea of allowing part of a favourable trade to continue.
9. Hedging
The source defines hedging as holding two or more contrasting positions at the same time in an effort to manage risk and reduce losses.
It covers perfect hedging, imperfect hedging and cross hedging.
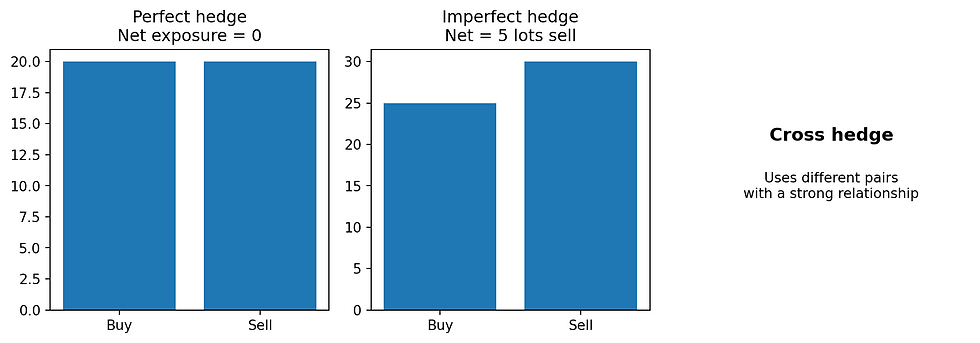
Perfect Hedging
Perfect, or direct, hedging uses long and short positions on the same currency pair with equal total size.
In the course example, 20 lots buy and 20 lots sell create zero net market exposure while the hedge remains in place.
Imperfect Hedging
Imperfect hedging also uses long and short positions on the same pair, but the sizes do not fully offset.
The course example totals 25 lots buy and 30 lots sell, leaving a net five-lot sell exposure.
Cross Hedging
Cross hedging uses different currency pairs that are believed to have a strong positive or negative relationship.
The source uses EUR/USD with USD/JPY as a negative-correlation example and EUR/USD with GBP/USD as a positive-correlation example.
Hedging Risks
The course warns that:
A perfect hedge fixes the net exposure.
An imperfect hedge does not eliminate all risk.
Correlations are not guaranteed.
Transaction costs can accumulate.
Hedging should therefore not be treated as a cost-free or risk-free solution.
10. A Risk-Management Routine

Plan
Before entering, know the account balance, intended risk amount and stop-loss level.
The course also notes that if a stop feels too tight, reducing position size can provide more room without automatically increasing the money at risk.
Analyse
Ask whether the available potential reward is sufficient to justify the risk before taking the setup.
Assess
While a position is open, reassess the risk-management plan and how the trade is developing.
Review
After trades, review whether stops were repeatedly too tight or too loose and whether profitable trades were consistently exited too early.
Key Takeaways
Position size and stop distance together determine how much money is exposed.
Risk-to-reward provides a structured way to compare potential loss with potential reward.
A stop loss defines where the trader accepts that the trade idea has failed.
Manual exits can be influenced by emotion; the source therefore favours pre-planned protection.
Trailing stops can help protect favourable moves but may be vulnerable to choppy price action.
Scaling in distributes planned exposure across multiple entries.
Scaling out realises portions of a position at different stages.
Hedging changes net exposure but introduces its own limitations and costs.
Risk management should be planned before entry and reviewed after execution.
Educational Notice: This material is provided for educational purposes only and explains general risk-management concepts. It does not constitute investment advice, a personal recommendation, or an offer or solicitation to buy or sell any financial instrument. Examples are simplified illustrations from the source course and may not reflect actual execution, spreads, commissions, slippage, financing costs, margin requirements or market gaps. Trading leveraged products involves significant risk.


Comments