
Lesson 5: Understanding Backtesting
How to Test a Trading Strategy on Historical Data Without Fooling Yourself
Backtesting is the process of applying predefined trading rules to historical market data to estimate how those rules would have behaved in the past.
It is one of the most useful tools in quantitative research because it allows a strategy idea to be challenged before real capital is exposed.
A backtest is not a time machine, and it is not proof of future profitability. Its value depends on the quality of the rules, data, execution assumptions and research process used to create it.

A good backtest is designed to challenge a strategy, not to make the strategy look good.
1. What Does a Backtest Actually Do?
A backtest takes a strategy specification and replays it across historical observations.
At each evaluation point, the test:
Calculates only the information that should be available.
Checks the strategy conditions.
Simulates the required action.
Records the resulting trade or portfolio state.
The output can then be summarised into performance statistics such as return, drawdown, win rate, expectancy and the number of trades.
2. Start With Rules, Not With Results
Backtesting should begin only after the strategy rules are sufficiently clear.
If the researcher changes the entry, exit or filter every time the historical result looks unattractive, the process can gradually become an exercise in fitting the past.
Before testing, document:
Market universe
Timeframe
Signal
Filters
Position-sizing method
Exit logic
Safety rules
This creates a reference point against which later changes can be evaluated.
3. Historical Data and Data Quality
Historical data is the raw material of a backtest.
Depending on the strategy, it may include:
Price bars
Tick data
Volume
Spreads
Corporate actions
Economic data
Other relevant variables
When preparing the data:
Check for missing observations and duplicate records.
Use consistent timestamps and time zones.
Confirm that the data frequency matches the strategy.
Understand how instruments, contracts or symbols changed through time.
Avoid silently filling gaps in a way that creates prices that never existed.
A sophisticated strategy tested on poor data can produce a precise-looking but unreliable result.
4. Avoid Look-Ahead Bias
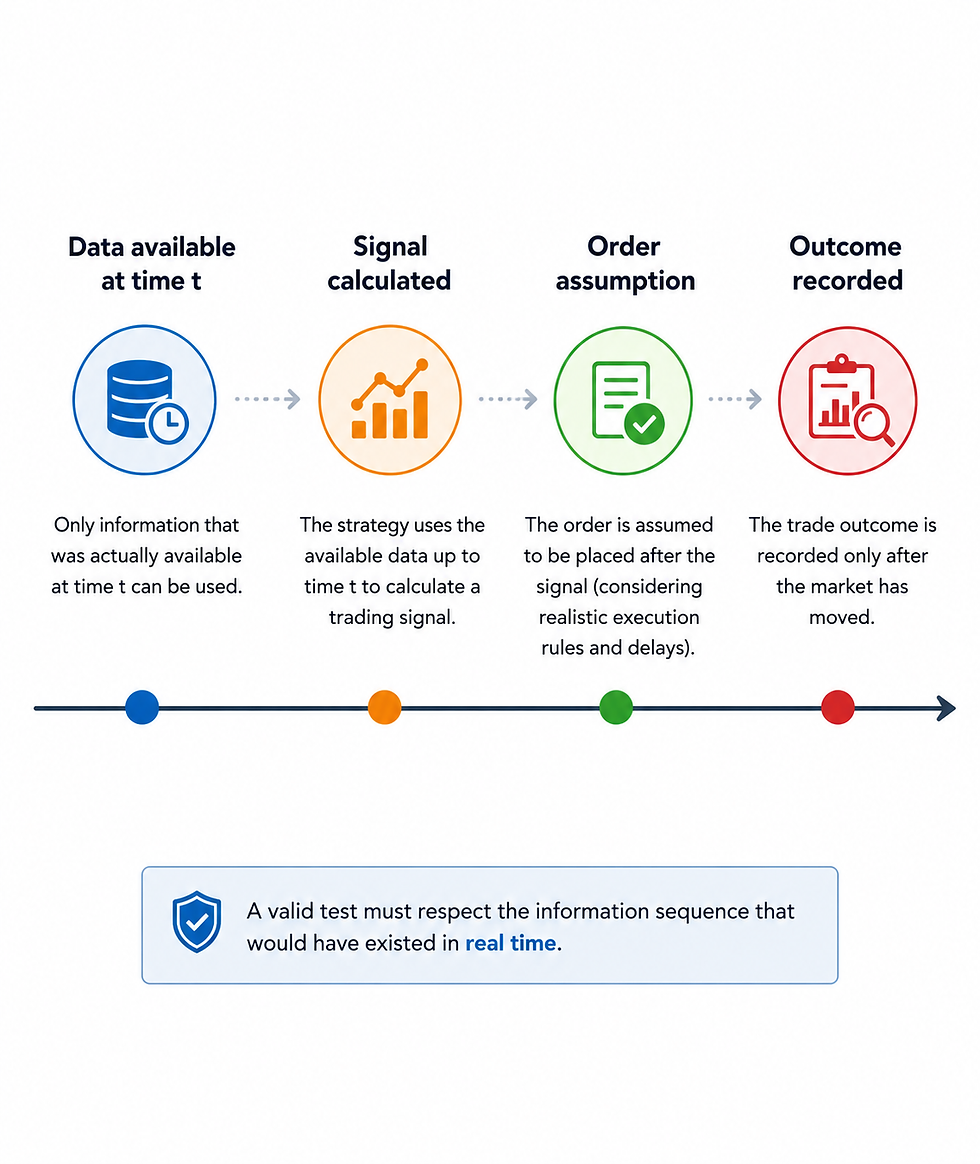
Look-ahead bias occurs when a historical decision uses information that would not actually have been known at that moment.
This can happen accidentally, especially when:
Indicators are calculated using future values.
Revised datasets are used without adjustment.
A trade is assumed to execute at a price that was only known after the signal.
A simple discipline is to ask:
At the exact simulated decision time, could the strategy genuinely have known every input used by the rule?
If the answer is no, the backtest is using future information.
5. Model Execution Realistically
A signal and an executed trade are not the same thing.
Real orders face:
Spreads
Commissions
Slippage
Market gaps
Liquidity constraints
Broker rules
A backtest needs explicit assumptions about how and when orders are filled.
For example, a strategy that creates a signal at the close of a bar should not automatically assume it was filled at an earlier price within that same bar unless the simulation method genuinely supports that assumption.
6. Trading Costs Matter
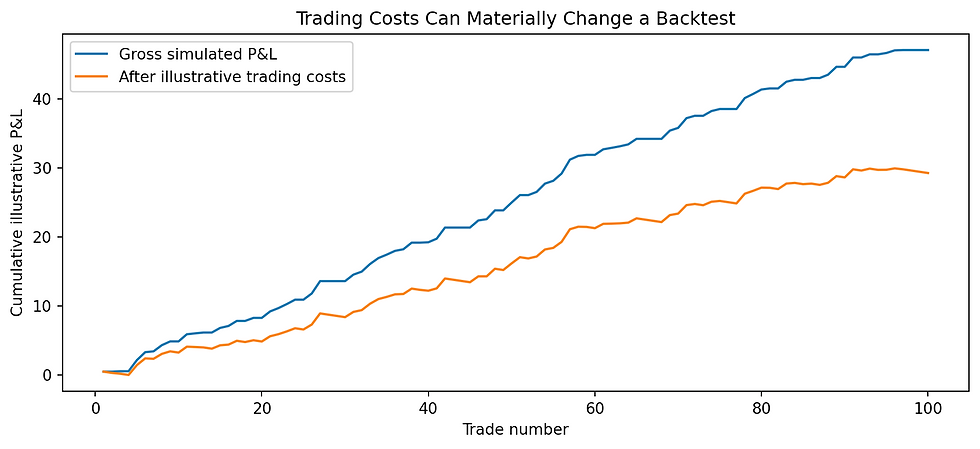
Costs can have a small effect on a low-turnover strategy and a very large effect on a strategy that trades frequently or targets small price movements.
Typical assumptions may include:
Spread
Commission
Slippage
Financing or holding costs, where relevant
A useful research habit is to test a range of plausible costs rather than relying on one optimistic number.
If a small increase in costs destroys the result, the strategy may have little margin for execution error.
7. In-Sample, Validation and Out-of-Sample Data
If the same historical data is repeatedly used to invent, adjust and evaluate a strategy, the researcher can unintentionally learn the noise of that particular period.
Separating data into different roles helps reduce this problem.

Dataset | Purpose | Main question |
In-sample | Develop the hypothesis and initial rules | Can the idea be expressed and tested? |
Validation | Compare limited design choices without repeatedly using the final test set | Are reasonable choices stable? |
Out-of-sample | Evaluate the finished specification on unseen data | Does the behaviour generalise beyond development? |
8. What Should You Measure?
A single headline return is not enough to judge a strategy.
Quantitative evaluation should examine both the outcome and the path taken to reach it.

Net Return
The result after the assumptions included in the test, such as trading costs.
Maximum Drawdown
The largest decline from a previous equity peak to a later trough.
Win Rate
The proportion of profitable trades. It must be interpreted together with average wins and losses.
Profit Factor
Gross profit divided by gross loss, providing one view of the relationship between winning and losing trades.
Expectancy
The average historical outcome per trade based on the strategy’s win/loss distribution.
Sharpe Ratio
A common risk-adjusted statistic that relates return to variability.
Trade Count
A very small sample can make performance statistics unstable or unrepresentative.
Exposure
How much time or capital the strategy actually has at risk.
9. Drawdown: The Part a Return Number Hides
Two strategies can finish with similar returns but create very different experiences along the way.
Drawdown helps describe how far the strategy declined from a previous peak before recovering or reaching the end of the test.

Drawdown is especially important when position sizing is considered.
A strategy that appears tolerable at one level of exposure may become difficult to sustain when leverage or position size is increased.
10. Overfitting: When the Backtest Learns the Past Too Well
Overfitting occurs when a strategy is tuned so closely to historical noise that it loses the ability to perform similarly on new data.
This can happen through:
Excessive parameters
Repeated optimisation
Trying many indicators
Selecting the best result from a large number of experiments
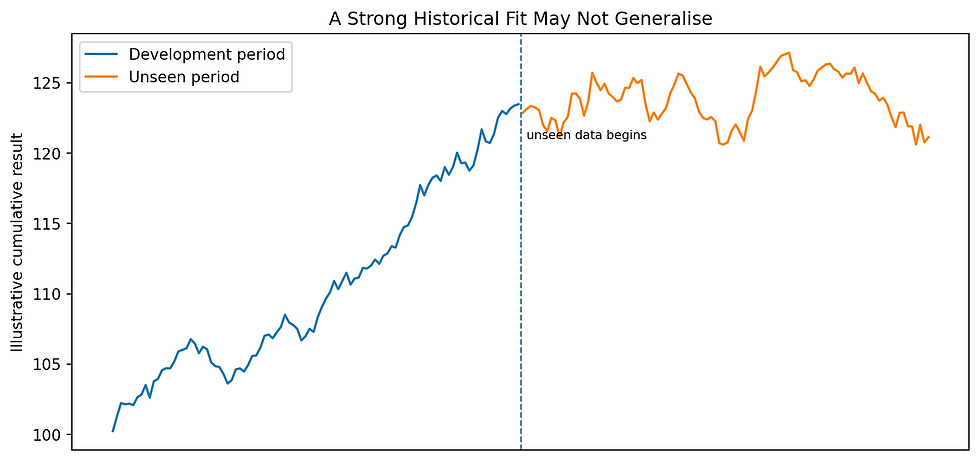
The danger is that an overfitted strategy often looks excellent in the exact dataset used to build it.
Its weakness becomes visible only when conditions change or the strategy is tested on genuinely unseen observations.
11. Parameter Sensitivity and Robustness
A robust strategy should not depend entirely on one unusually precise parameter value.
If a moving-average length of 30 produces an attractive result but 29 and 31 produce poor results, the apparent optimum may be fragile.

Sensitivity testing changes parameters within reasonable ranges and observes whether the strategy’s broad behaviour remains similar.
The objective is not to find the highest historical result. It is to understand how dependent the result is on specific choices.
12. Backtest the Strategy You Could Actually Trade
A realistic backtest should reflect the intended implementation as closely as practical.
If the live strategy will trade only during certain sessions, apply those rules historically.
If the platform imposes minimum-volume or order-distance constraints, those assumptions should not be ignored.
This principle also applies to risk. The historical simulation should use the same position-sizing and exposure logic intended for the actual system rather than adding leverage only because it makes the historical return look larger.
13. Common Backtesting Mistakes
Testing Before Defining the Strategy
Repeatedly changing vague rules after seeing results encourages data fitting.
Using Future Information
Look-ahead bias can make a strategy appear far stronger than it could have been in real time.
Ignoring Costs
Gross results can overstate the performance available after execution.
Assuming Perfect Fills
Historical high and low data does not guarantee that every desired order would have been executed at that price.
Reusing the Out-of-Sample Set
Once unseen data has influenced strategy changes, it is no longer genuinely unseen.
14. A Practical Backtesting Workflow
Write the strategy rules before running the test.
Choose historical data appropriate for the instrument and timeframe.
Clean and validate the dataset.
Define exactly when signals are calculated and orders are assumed to execute.
Include realistic trading-cost assumptions.
Run the initial backtest and inspect both trades and summary metrics.
Evaluate drawdown, sample size and exposure as well as return.
Test reasonable parameter variations.
Keep independent data for out-of-sample evaluation.
Document every meaningful strategy change and test result.
15. What Backtesting Can—and Cannot—Tell You
Backtesting can show whether a clearly defined idea would have produced certain historical behaviours under a chosen set of assumptions.
It can help identify weaknesses, estimate risk characteristics and compare alternative rule sets.
It cannot:
Guarantee that the same relationship will continue.
Fully reproduce future execution conditions.
Remove uncertainty from trading.
A backtest should therefore be treated as evidence within a research process rather than as a prediction.
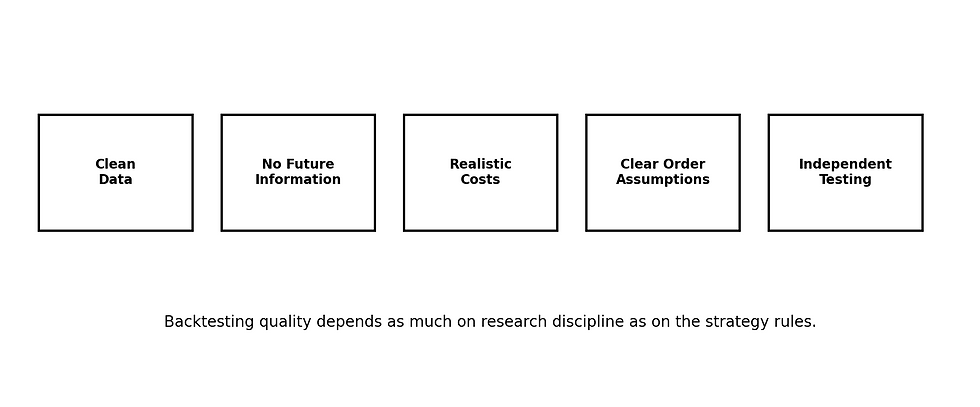
The purpose of backtesting is not to prove that a strategy works. It is to discover how easily the strategy can fail.
Key Takeaways
Backtesting replays objective strategy rules on historical data.
Data quality and timing assumptions are fundamental to test validity.
Look-ahead bias must be actively prevented.
Spreads, commissions, slippage and other costs can materially change results.
Development and genuinely unseen evaluation data should be separated.
Return should be reviewed alongside drawdown, expectancy, trade count and exposure.
Overfitting can create impressive historical results that do not generalise.
Parameter sensitivity helps reveal whether a strategy is robust or fragile.
A backtest is a research tool, not a guarantee of future performance.
Educational Notice: This material is provided for educational purposes only. Examples and charts are simplified illustrations of quantitative-research concepts and do not constitute investment advice, a personal recommendation or a guarantee of trading performance. Historical, simulated and backtested results do not guarantee future outcomes. Trading, particularly with leveraged products, involves significant risk.


Comments