
Lesson 7: Overfitting — Why a Great Backtest Can Fail
Understanding Curve Fitting, Data Snooping and the Difference Between Historical Fit and Robustness
A backtest can look exceptionally strong and still provide weak evidence about the future. One of the main reasons is overfitting: the strategy has been shaped so closely around the historical sample that it captures noise, coincidences or temporary relationships rather than a pattern that can generalise.
Overfitting is especially important in quantitative trading because computers make it easy to test thousands of combinations quickly. More testing can improve research, but it can also increase the chance of discovering a historical result that looks impressive purely by accident.

The best-looking backtest is not automatically the strongest strategy.
1. What Is Overfitting?
Overfitting occurs when a model or trading rule becomes too specialised to the data used during development. Instead of learning a broad relationship, it learns details that may be unique to one historical sample.
In trading, those details can include random price sequences, one-off market events, temporary volatility conditions or accidental relationships between indicators.
Fit vs. Generalisation
Fit describes how well a strategy explains or performs on the data used to build it. Generalisation describes whether similar behaviour remains when the strategy encounters data it did not use during development.
Quantitative research needs both, but generalisation is the harder test.
2. How Overfitting Happens in Practice
Overfitting does not require an extremely complicated machine-learning model. It can happen in a simple technical strategy if the researcher repeatedly changes rules after seeing the historical results.

For example, a researcher may change a moving-average length after a losing period, add an RSI filter after another loss, exclude one trading session, adjust the stop, and then select the combination with the highest historical return.
Each decision may appear reasonable individually, but together they allow the historical sample to influence the strategy repeatedly.
3. Too Many Parameters
Every adjustable parameter gives the strategy another way to adapt to historical data. Parameters are not inherently bad, but a large number of thresholds, lookback periods, filters and exceptions increases the number of possible strategy variations.
A strategy with ten adjustable inputs can represent an enormous number of combinations. Searching enough combinations makes it easier to find one that fits past data well even when the underlying relationship is weak.

4. The Problem of the “Perfect” Parameter
Suppose a strategy performs best with a 31-period lookback but becomes poor at 30 or 32. That isolated optimum deserves scrutiny. A genuine market relationship would often be expected to survive small, reasonable changes rather than disappear immediately.

Parameter sensitivity testing therefore looks around the chosen setting. Researchers often prefer a stable plateau of reasonably similar outcomes to one sharp historical maximum.
5. Data Snooping and Multiple Testing
Data snooping occurs when the same dataset is searched repeatedly for profitable patterns. Even if each individual test is conducted correctly, the collection of many tests creates a statistical problem: eventually, some variants may look successful by chance.

This is why the number of experiments matters. Selecting the best result from hundreds of attempts is not equivalent to testing one hypothesis that was specified in advance.
6. In-Sample Success Can Be Misleading
The data used to design or optimise a strategy is commonly called in-sample or development data. Strong performance here is useful for research, but it is also the least surprising place for the strategy to look good because the rules were influenced by that history.

A meaningful warning sign is a large gap between development performance and genuinely unseen performance. Some deterioration is normal, but a complete collapse suggests that the historical fit may have captured relationships that did not generalise.
7. Out-of-Sample Testing
Out-of-sample testing reserves a portion of data that does not influence the strategy’s construction. Once the rules are considered complete, the strategy is evaluated on this unseen period.
The discipline is important: if the researcher sees the out-of-sample result, changes the strategy, and tests the same period again, that data has now influenced development and is no longer truly unseen.
Unseen data is a limited resource. Once it changes your strategy, it becomes part of the development process.
8. Keep the Hypothesis Simple Enough to Explain
Simplicity does not guarantee robustness, and complexity is not automatically wrong. However, every additional rule should have a clear reason for existing.
A useful question is: can the researcher explain why each filter or parameter belongs in the strategy without referring only to the fact that it improved the backtest?
If the only justification is historical performance, the rule may be fitting noise rather than representing a defensible hypothesis.
9. Beware of Exception Rules
Rules such as “do not trade on this particular weekday during this particular month unless volatility is below a specific value” may sometimes have a genuine rationale, but a growing collection of narrow exceptions is a common sign of curve fitting.
Exception rules should be treated especially carefully when they were added after observing individual historical losses.
10. Trading Costs Can Expose Fragile Edges
A strategy may appear robust before costs but become unprofitable after slightly less favourable assumptions for spread, commission or slippage. This suggests that the historical edge may be too small to tolerate realistic execution uncertainty.
Cost stress testing deliberately makes execution assumptions less favourable. The objective is not to predict the exact future cost but to ask whether the strategy has a reasonable margin for error.
11. Test Across Different Market Regimes
A strategy may accidentally be optimised for one environment, such as a strong trend, unusually low volatility or a specific monetary-policy period. Evaluating behaviour across different regimes helps identify this dependence.
The goal is not to require identical performance everywhere. A trend strategy may reasonably struggle in a range. What matters is understanding whether the observed historical edge is broad enough to survive more than one narrow episode.
12. Walk-Forward Thinking
Walk-forward analysis repeatedly moves through time: a strategy is developed or calibrated on an earlier window and then evaluated on a later window before the process advances. This creates a sequence of development and forward-testing periods.
Walk-forward methods can provide a more realistic view of how a strategy might behave when parameters or models are periodically updated, although they do not remove overfitting automatically.
13. Robustness Testing Toolkit

Unseen Data
Evaluate the finished specification on observations that did not influence its design.
Parameter Sensitivity
Check whether nearby settings produce broadly similar behaviour.
Walk-Forward Testing
Repeat development and forward evaluation through multiple historical windows.
Cost Stress Testing
Increase spreads, commissions or slippage assumptions to test execution margin.
Regime Testing
Review performance across different volatility, trend and market environments.
14. Overfitting Red Flags
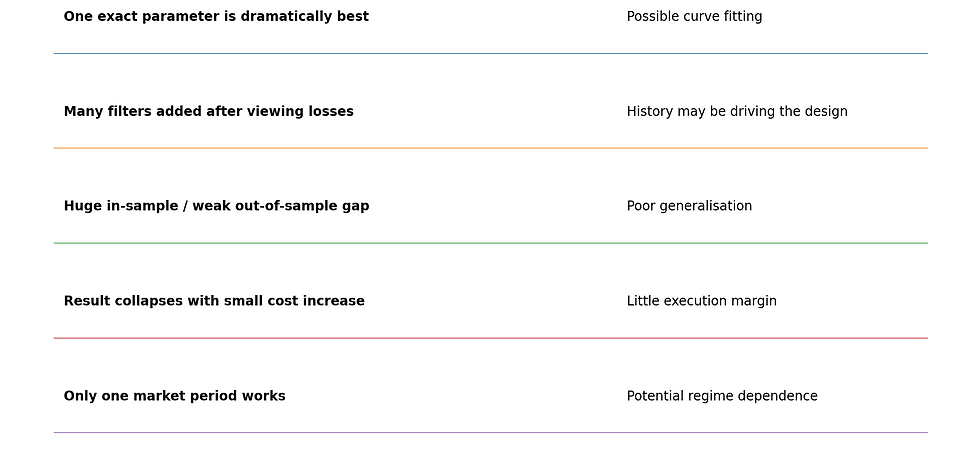
No single warning sign proves that a strategy is overfit. The concern becomes stronger when several appear together—for example, many parameters, one unusually precise optimum, repeated rule changes and a large deterioration on unseen data.
15. A Better Research Process
Start with a market hypothesis rather than searching randomly for profitable combinations.
Write the core rules before reviewing detailed backtest outcomes.
Limit unnecessary parameters and require a reason for each one.
Record how many strategy variants and parameter combinations were tested.
Keep genuinely unseen data separate from development decisions.
Evaluate nearby parameter values rather than only the historical optimum.
Stress trading-cost and execution assumptions.
Review different time periods and market regimes.
Prefer repeatable evidence over one spectacular backtest.
Document failed experiments as well as successful ones.
16. What Robustness Does—and Does Not—Mean
A robust strategy is not one that makes money in every test. Robustness means that the central behaviour is not destroyed by small, reasonable changes in data, parameters, costs or evaluation period.
Even a well-tested strategy can fail in the future because markets change. Robustness testing therefore reduces certain research risks; it does not eliminate uncertainty.
Robustness is evidence that an idea is less dependent on one historical accident—not a guarantee that it will remain profitable.
Key Takeaways
Overfitting happens when a strategy learns historical noise rather than a durable relationship.
Repeated optimisation on the same dataset increases the risk of curve fitting.
More parameters create more opportunities to fit accidental patterns.
An isolated “perfect” parameter can be a warning sign of fragility.
Testing many strategy variants can produce impressive results by chance.
Out-of-sample data should remain genuinely unseen until the strategy is substantially complete.
Parameter, cost, regime and walk-forward tests can help assess robustness.
A simpler, explainable hypothesis is often easier to challenge and maintain.
Robustness testing reduces research risk but cannot guarantee future performance.
Educational Notice: This material is provided for educational purposes only. Charts and examples are simplified illustrations of quantitative research concepts and do not constitute investment advice, a personal recommendation or a guarantee of trading performance. Historical, simulated and backtested results do not guarantee future outcomes. Trading, particularly with leveraged products, involves significant risk.


Comments